SCS Market Scanner
Multi-symbol screener for Sierra Chart: scan your entire watchlist for setups in real time from a standalone desktop terminal
$99
One-time purchase · Lifetime updates included
You will be asked to sign in before checkout
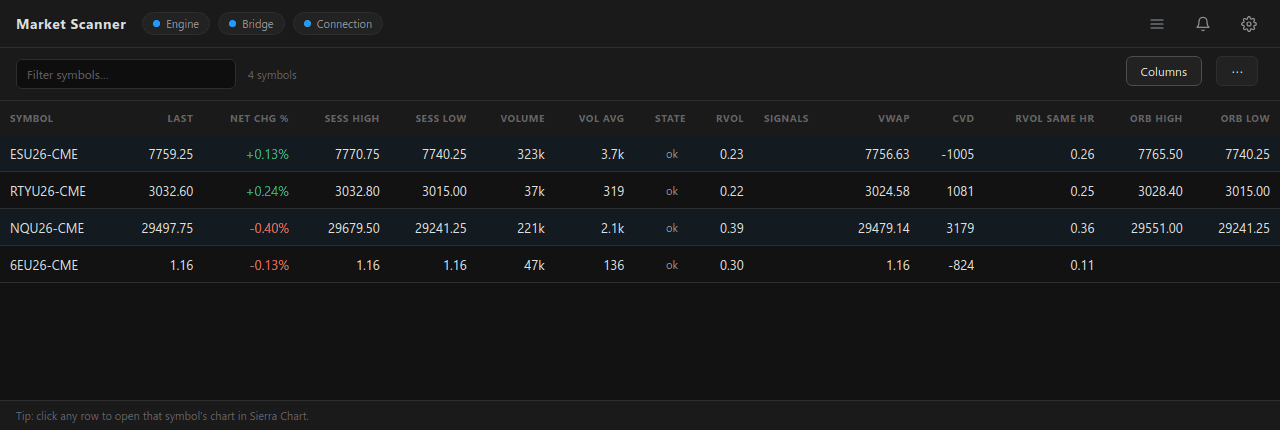
Whole-Watchlist Screening
Scan every symbol in your list in real time from one desktop window. No chart-flipping, no missed setups.
Bridge + Engine Studies
A Bridge study exports per-symbol data and an Engine study computes the scan signals, delivered automatically through the Sierra Chart API.
Standalone Windows App
A sortable, filterable table of every symbol with its live scan state. No cloud, no account, no dependencies.
Features
- Scans an entire watchlist of symbols in real time from a single desktop window, no chart-flipping
- Two Sierra Chart studies work together: an Engine study reads every watchlist symbol and publishes the live scan feed, a Bridge study switches your display chart to the symbol you click
- Standalone Windows desktop app: a sortable, filterable table showing every symbol with its live scan state
- Configurable scan criteria so the screener surfaces only the symbols matching your setup
- Real-time updates as new bars and ticks arrive, with a clear visual highlight the moment a symbol triggers
- Runs entirely on your machine: no cloud, no account, no third-party data sharing
- One-time purchase with lifetime updates included, activated with a license key on up to 2 machines
- The two studies are delivered automatically through the Sierra Chart API: just restart Sierra Chart and add them from Analysis > Studies > Add Custom Study
- Windows 10/11 (64-bit), lightweight install, no Python and no external dependencies
Description
Market Scanner is a multi-symbol screener for Sierra Chart. It watches your whole watchlist in real time from a single standalone desktop window, highlights the symbols that meet your conditions, and switches your Sierra Chart display chart to any symbol with one click. Everything runs on your machine: the two Sierra Chart studies and the desktop app exchange small files inside your Sierra Chart Data folder, and nothing is sent anywhere unless you connect a Discord or Telegram channel yourself.
It ships as two parts that work together:
- Two Sierra Chart studies, delivered automatically through the Sierra Chart API when you purchase. The Engine provisions one hidden chart per watchlist symbol, reads them all, and publishes the live scan feed. The Bridge does the click-to-chart part: it switches the symbol of the one display chart it is attached to. You never download a DLL: restart Sierra Chart and both studies appear under Analysis > Studies > Add Custom Study.
- A standalone Windows app, a real installer you download after purchase. It reads the Engine feed, renders the scanner grid, evaluates your alert rules, and delivers alerts to your desktop, to Discord, and to Telegram.
Installation
The two Sierra Chart studies
Both studies live in a single DLL named MARKET_SCANNER, so you get a single authorization on your Sierra Chart account and both studies at once.
- After purchase, restart Sierra Chart. Two entries appear under Analysis > Studies > Add Custom Study: Market Scanner - Engine and Market Scanner - Bridge.
- Add Market Scanner - Engine to one chart that stays open all session. It does not need to be visible or in the foreground, it just needs to stay alive: this is the chart that hosts every hidden chart the Engine opens for your watchlist.
- Add Market Scanner - Bridge to one display chart, the chart you want the scanner to drive when you click a row.
Neither study has any input to configure. Everything (watchlist, session, thresholds, alerts) is set from the desktop app, which writes the configuration into the Sierra Chart Data folder for the Engine to pick up live.
Two rules about the Bridge chart
- The Bridge chart must not be a trading chart. The Bridge refuses to run on a chart in Chart Trade Mode and reports
refused_trading_chart, on purpose: it must never change the symbol of a chart you can send orders from. If clicking a row does nothing, this is the first thing to check. - Do not put the Bridge on several charts. Each instance keeps its own record of the last navigation it applied, so two Bridges would both switch, and would overwrite each other's acknowledgement file. One Bridge, one display chart.
The desktop app
- Download the Market Scanner installer from your account dashboard and run it.
- Launch the app and enter your license key on the activation screen. The key activates on up to 2 machines.
- Open Settings (the gear in the top bar) and add your symbols to the Watchlist.
The Scanner Grid
The main window is one live table, one row per watchlist symbol, refreshed as fast as the Engine publishes (about every 400 ms). Rows are reconciled rather than rebuilt, so sorting, filtering, scroll position and keyboard focus survive every update.
Columns
| Column | What it shows |
|---|---|
| Symbol | The full Sierra Chart symbol, as entered in the watchlist |
| Last | Last traded price |
| Net Chg % | Change against the previous day's close, from the symbol's own daily data |
| Sess High | Session high for the current trading day |
| Sess Low | Session low for the current trading day |
| Volume | Today's volume, abbreviated in the grid (702k, 1.63M) |
| Vol Avg | Average volume of the last completed 1-minute bars, over the Vol Avg Period you set |
| State | warming while Sierra Chart is still loading that symbol's data, ok once it is live |
| RVOL | Relative volume: today's volume against the average of the previous 20 days |
| Signals | One badge per alert rule currently matching this symbol |
Five order-flow columns are fed by the Engine from the tick data of each symbol. VWAP, CVD and RVOL Same Hr are shown by default; ORB High and ORB Low are switched on from the Columns menu. If the study loaded in Sierra Chart does not publish order flow, they are hidden rather than shown empty, and the Columns menu says why. A value that is not available renders as an empty cell rather than a zero, which is a normal state during warm-up, on an instrument with no regular session (the opening range), or before enough history exists (same-hour RVOL). See Order flow below.
Conditional colouring
Net Chg % is colour-coded by sign and size: full colour for any nonzero move, a stronger shade past 1%, the strongest past 3%. Exactly flat is the only neutral value, so direction is readable at a glance without reading the number.
RVOL and RVOL Same Hr use a different scale, because they are multiples of an average rather than signed moves: dimmed below the average, plain between 1× and 2×, amber from 2×, bold amber from 4×. Unusual volume is therefore visible by sweeping the column, without reading a single figure. A derived RVOL (italic, with a leading ~) is coloured on the same scale, so an approximate 4× still stands out, while the italics and the tilde keep saying that the value is estimated.
A row flashes blue for a moment whenever its last price changes, so activity is visible even when you are looking elsewhere on the grid.
Sorting, filtering, density
- Sort: click any column header to sort ascending, click again for descending. The sort is re-applied on every update, so it keeps holding as prices move. On the columns fed by an Engine study value (RVOL today), a symbol with no value yet sorts to the bottom in both directions, since unknown is neither the smallest nor the largest. Headers are keyboard reachable: Tab to one and press Enter or Space.
- Filter: the search box at the top filters symbols by name as you type, and the counter next to it reads
4 of 12while a filter is active. Escape clears it. - Columns: the Columns button opens a checklist of every available column. Symbol cannot be hidden. Your selection is saved and restored at the next launch, and if you hide the column you were sorting by, the grid falls back to feed order instead of staying sorted by an invisible column.
- Density: the row-density button in the top bar switches between comfortable and compact rows, and the choice is remembered.
Keyboard navigation and click-to-chart
Click any row to switch your Bridge chart to that symbol. For the keyboard: give the grid focus with Tab, then use the Up and Down arrows to move the highlighted row and Enter to open it. The top bar reports the result of the last click, so you always know whether Sierra Chart followed.
Export CSV
The More actions menu (⋯) has Export CSV, which copies the current view to the clipboard: the same columns in the same order, sorted and filtered exactly as displayed, ready to paste into a spreadsheet. Volume and Vol Avg are exported as raw integers rather than the abbreviated grid form, so the numbers stay summable.
Data Feeds
Market Scanner does not carry its own market data. It reads what Sierra Chart already receives, so whatever your Sierra Chart data feed provides is what the scanner can show. Most columns work on any feed; two of them have a real requirement.
| What you want | What your feed must provide |
|---|---|
| Last price, net change %, session high and low, volume, average volume, RVOL, same-hour RVOL, ORB High and ORB Low | Total volume only. Any Sierra Chart feed that serves the instrument works. |
CVD |
Volume split between bid and ask. A feed that only reports total volume leaves this column empty, on every symbol. |
ORB High and ORB Low |
A regular session defined on the chart. The opening range is anchored to the regular session, so a 24-hour instrument with no regular session reports no ORB. |
A missing requirement never produces a wrong number: the value is left empty rather than shown as zero. See When a value is withheld under Order Flow.
Symbol naming depends on your feed
Each feed names the same instrument its own way. On Denali, the September 2026 Nasdaq future is NQU26-CME; Interactive Brokers and Rithmic write it differently. The scanner passes your symbol to Sierra Chart exactly as you typed it and matches it character for character, so the reliable method is to copy the symbol from a chart that already works on your connection.
Watchlist
The Watchlist section in Settings is where you declare what the Engine tracks. Up to 20 symbols are scanned.
- Symbols must be written exactly as your data feed names them. The naming depends on your feed: on Denali it is root, month code, year and exchange, for example
NQU26-CME, while Interactive Brokers and Rithmic name the same instrument differently. The safest way is to copy the symbol from a chart that already works. A name the feed does not resolve, such as a bareNQ, opens a chart that never receives data, and the row stays stuck (see Troubleshooting). - Levels are optional, comma separated prices attached to a symbol. They are the price levels the Engine watches for crossings, and they are what the Level cross alert condition can reference. Levels are cleaned up as you save them: blanks and non-numeric entries are dropped, duplicates removed, and the list sorted.
- Adding a symbol that is already in the list updates it in place rather than creating a duplicate. Each row has an inline field to edit its levels and a button to remove the symbol.
Every watchlist change is applied live. Symbols still present keep their loaded charts (no reload, no re-warming), only the charts of removed symbols are closed, and newly added symbols warm up on their own.
Alerts and Rules
A rule is a named set of conditions, targeted at one or more symbols, combined with AND or OR. Rules are evaluated on every feed update, for every symbol they target.
Building a rule
The rule editor takes, from top to bottom: a name (leave it blank and a readable one is derived from the conditions, for example NQU26-CME: change% > 1.5), an Enabled checkbox, the symbols it applies to (one checkbox per watchlist symbol), and the conditions themselves. The Template selector is a shortcut that preselects the right condition type; Advanced leaves the editor free so you can stack several conditions in one rule.
| Condition | Fires when |
|---|---|
| Price | Last price is above or below a value |
| % change | Net Chg % is above or below a value |
| Level cross | The price crosses one of the symbol's configured levels, upward or downward |
| Session break | The symbol posts a new session high, or a new session low |
| Volume spike | The last completed 1-minute bar exceeds the Vol Spike multiple of the recent average |
| VWAP cross | The last price is above, or below, the session VWAP |
| ORB break | The last price is above the opening-range high, or below the opening-range low |
| Study value | A named value published by the Engine is above or below a threshold (rvol, vwap, cvd, rvolSameHour, orbHigh, orbLow) |
Add each condition with Add condition, and it appears as a removable chip. Choose AND (all) or OR (any) for how they combine, then save. Level cross only offers the levels actually configured for the selected symbols, so a rule can never silently reference a level nobody is watching. An incomplete condition is refused with an explanation instead of being ignored.
Saved rules are listed underneath with their symbols, logic and condition count. edit loads a rule back into the editor for in-place changes, remove deletes it. Disabled rules are kept but not evaluated at all.
How a rule fires
Alerts are edge triggered: a rule fires once when it starts matching, and does not fire again until it has stopped matching and starts again. A rule targeting several symbols is latched per symbol, so ES matching does not suppress NQ's own first trigger.
Rules are only evaluated on symbols in the ok state, so a symbol still loading never produces a phantom alert, and its first genuine match still triggers cleanly. Deleting a rule, disabling it, or removing a symbol from a rule discards the corresponding latch, so re-enabling it later starts from a clean edge.
Where alerts show up
- The Signals column shows a badge for every rule currently matching that row, live, whether or not the rule has just fired.
- A toast appears at the corner of the window for about five seconds with the symbol, the rule name and the time.
- The bell in the top bar opens the alert history: the last 100 alerts, newest first, with a badge counting the ones you have not opened the panel to see yet.
- A sound can be played on every alert. It is off by default and is enabled in App Settings.
Alert delivery: desktop, Discord, Telegram
Alerts can leave the app through three independent channels. Every channel that is configured receives every alert.
OS desktop notifications
On by default. Standard Windows notifications, so alerts reach you when the scanner window is behind your charts. Switching them off silences only the OS notification, not the in-app toast, the sound or the other channels.
Discord
Paste a Discord channel webhook URL into App Settings and alerts are posted to that channel. The Test button posts a recognisable test message to the URL currently in the field, before you even save it, so you can confirm the webhook end to end.
Delivery is paced and resilient: posts are queued at no more than one per second, a rate limit is honoured exactly as Discord asks (its own Retry-After value is used), server errors are retried with exponential backoff up to 5 attempts, and an alert that has been stuck in the queue for more than two minutes is dropped rather than posted late and misleading. A permanent failure (a deleted or invalid webhook, for example) is reported in the app as a delivery error instead of failing silently.
Telegram
- Create a bot with @BotFather in Telegram and copy the token it gives you.
- Paste the token in App Settings and click Connect.
- Send any message to your bot. The app captures your chat automatically within about a minute, and the field then reads
Connected ✓with the chat id.
Test sends a test message through the saved connection, Disconnect removes the token and the chat id. Your bot token is encrypted with the operating system's secure storage and never leaves the machine except to Telegram's own API, and it is never sent back to the app window. Telegram has its own delivery queue, so a Telegram rate limit can never slow Discord down, and vice versa.
Click-to-chart navigation
Clicking a row asks the Bridge to switch its chart to that symbol, and the Bridge answers. The top bar reports the answer:
| What you see | What it means |
|---|---|
display: NQU26-CME |
The Bridge switched its chart to that symbol |
NQU26-CME: still loading… |
The symbol's data is not ready yet. The Bridge refuses rather than switching to an empty chart, and the app retries that same navigation on its own a moment later. Nothing to do |
NQU26-CME: still loading, click again |
Same refusal, but the automatic retry has already been spent on this navigation. Click the row again once the symbol reaches ok |
display chart is in trade mode: pick a non-trading chart |
The Bridge is attached to a chart in Chart Trade Mode and will not touch it. Move the Bridge to a dedicated display chart |
Navigation is also robust across restarts: the app never confirms a navigation from a previous session as if it belonged to the current one.
Health indicators
Three pills in the top bar tell you, at a glance, whether the chain is intact:
| Pill | Green when |
|---|---|
| Engine | The Engine study is running and publishing its heartbeat |
| Bridge | The Bridge study is running on a chart |
| Connection | The feed file is fresh, that is, updated within the staleness window |
Connection turns amber when the feed is fresh but carries no symbols (an empty watchlist), and red when the feed has gone stale, with an explicit Sierra Chart disconnected message. Before any data has ever arrived, the grid area itself explains what is missing, for example that the Engine has not been added to a chart yet. If a study and an app version ever disagree on the feed format, the app says so and tells you to re-authorize and restart Sierra Chart rather than silently showing nothing.
App Settings
Settings open from the gear in the top bar and hold the Watchlist, the Rules and the App Settings card. Changes to Discord, sound, notifications and the four fields below are applied with Save settings; the density and column choices save the instant you make them.
| Setting | Default | Effect |
|---|---|---|
| Session | ETH | Whether the Engine's hidden charts include the evening session. Changing it reloads the symbol charts under the new session |
| Vol Avg Period (bars) | 20 | How many completed 1-minute bars the average volume, and therefore RVOL's fallback and the volume spike test, is computed over |
| Vol Spike × | 3 | How many times the average volume a completed bar must exceed to count as a spike |
| Opening Range (min) | 15 | Length of the opening-range window that defines ORB High and ORB Low, measured from the regular session open |
| Staleness (ms) | 3000 | How old the feed file may get before the Connection pill reports a disconnection |
| Discord webhook URL | empty | Discord channel to post alerts to. Empty disables the channel |
| Play a sound when an alert fires | off | A short audible beep on every alert |
| Show OS desktop notifications | on | Windows notifications on every alert |
Session, Vol Avg Period and Vol Spike are not app-only preferences: they are pushed to the Engine as soon as you save, so the studies apply them without waiting for an unrelated watchlist edit.
What the Engine computes
For each watchlist symbol, the Engine opens three hidden charts: a 1-minute intraday chart for live price, volume and event detection, a daily chart for the session's true high and low, the previous close and the relative-volume baseline, and a 15-minute chart holding 30 days of history for the same-hour relative volume. With a full watchlist of 20 symbols that is 60 hidden charts, opened progressively (a few per pass) so Sierra Chart is never asked to load everything at once, with price data prioritised over the same-hour history. The charts are hidden, so your workspace is untouched, and they are closed again when the study is removed or a symbol leaves the watchlist.
- Net Chg % is computed against the previous completed day's close, not against the session open.
- Sess High / Sess Low come from the daily bar of the current trading day. While the daily chart is still loading, the intraday extremes are used so the row is never blank.
- RVOL is today's volume divided by the average volume of the previous 20 days. Until the daily history is loaded, the grid shows an approximate value prefixed with
~, computed as current volume divided by Vol Avg, and flags it in a tooltip so it is never mistaken for the real figure. - Volume spike looks at the last completed 1-minute bar (never the bar being formed) and compares it against the mean of the preceding bars. It fires at most once per bar.
- Session breaks compare against the extreme already seen, and re-seed at the start of a new trading day, so the first tick of a session is never reported as a break.
- A staleness guard protects you from dead data: if a symbol's most recent bar is more than 30 minutes old, which is what an expired or delisted contract looks like, all its events are suppressed and its RVOL is withheld rather than alerting you on stale prices.
Order flow
The Engine also reads each symbol's tick data directly and folds it into four order-flow values, computed from completed 1-minute bars and reset at the start of each trading day.
- VWAP and CVD accumulate over the session window your Session setting selects. VWAP is the volume-weighted average price; CVD is the running sum of ask volume minus bid volume, so a positive value means net buying pressure since the session open. Records outside the window are dropped, never clamped, so an evening session cannot keep feeding a value presented as a regular-session average.
- ORB High / ORB Low bound the opening range, anchored on the regular session open even when you run in ETH, over the Opening Range length you set. The two bounds are published as a pair or not at all, so an ORB break alert can never fire on a half-measured range. An instrument with no distinct regular session has no opening range, and its ORB is omitted rather than invented.
- RVOL Same Hr compares the current 15-minute slot against the same slot of up to 20 previous sessions, which removes the bias that makes plain RVOL structurally low early in a session. It needs at least 5 previous sessions for that slot before publishing anything.
- An order-flow value is published only when the Engine can prove it read the right instrument, and that the read was coherent: the last record consumed must be recent and its price must agree with the last price being published for that symbol. Otherwise the values are omitted for that symbol on that pass. A blank cell always means "no value", never zero.
Data, privacy and files
Market Scanner is local-first. The app and the studies communicate through small JSON files in your Sierra Chart Data folder (the feed the Engine publishes, the watchlist and navigation commands the app writes, and the two heartbeat files). Your watchlist, rules and settings are stored in the app's own local data folder. No market data, no watchlist and no alert content is sent anywhere, except to the Discord webhook or Telegram bot you configure yourself. The app window itself has no network access at all.
License and activation
Market Scanner is a one-time purchase with lifetime updates included. After checkout you receive a license key, entered at first launch. The key activates on up to 2 machines, and the two Sierra Chart studies are authorized on your Sierra Chart account automatically, with nothing to enter on that side.
Activation is online. Afterwards the license validates locally and offline use is never blocked. Settings has a Deactivate license button to release the current machine, and it only locks the app when the server confirms the deactivation, so a network failure can never lock you out of your own app.
Updates
The app updates itself. When a new version is published, a banner appears at the top of the window with a Download button, shows download progress, and then offers Restart & install. The installer is signed by SSL.com (publisher: SCStudies), so updates apply without Windows SmartScreen friction.
Troubleshooting
| Symptom | Cause and fix |
|---|---|
| The activation screen refuses your key | Check the key against your SCS dashboard, and that this machine is online: activation itself needs the network, even though everything afterwards works offline. A key bought for another SCS app is reported as the wrong product rather than as an invalid key |
| All your activations are used up | A key runs on two machines. Settings has a Deactivate license button that frees the machine you are on, so use it before reinstalling or changing computer. If a machine is gone and cannot be deactivated from itself, contact support and we release it for you |
A row stays on warming, then reads no data? |
Sierra Chart could not resolve the symbol. Write it exactly as your own data feed names it (on Denali, NQU26-CME; other feeds differ), not a short name such as NQ. Copying it from a chart that already works removes any doubt |
| Clicking a row does nothing | The Bridge is on a chart in Chart Trade Mode (the top bar says so), or the Bridge study is not added to any chart (the Bridge pill is red) |
still loading, click again |
The Engine has not finished warming that symbol, and the automatic retry has already been spent on this navigation. Wait for its State to read ok, then click again. The shorter still loading… means a retry is already on its way, so it needs no action |
| Engine pill red | The Engine study is not on any chart, or Sierra Chart is closed. Add Market Scanner - Engine to a chart that stays open |
| Connection pill red | The feed file has stopped being updated. Check that Sierra Chart is running and that the Engine is still attached |
| Version mismatch message | The studies and the app are from different versions. Re-authorize the studies and restart Sierra Chart |
| Telegram Connect times out | Send a message to your bot while Connect is running. If another program is polling the same bot, or the bot has a webhook configured, Telegram refuses a second reader and the app reports it |
| Discord delivery error | The webhook was deleted or is invalid. Create a new one and test it with the Test button |
Requirements
| Requirement | Specification |
|---|---|
| OS | Windows 10/11 (64-bit) |
| Sierra Chart | Required, with the Engine and Bridge studies attached |
| Watchlist size | Up to 20 symbols |
| Installation | Download the installer, double-click, done |
| Dependencies | None, fully standalone |
| Internet | License activation and updates only. Market data never leaves your machine |
Reviews
No reviews yet. Be the first to review this product!