Trading Journal is a desktop application purpose-built for Sierra Chart and NinjaTrader traders who want to track, analyze, and improve every trade they take. Unlike web-based journals that require manual entry and store your data on third-party servers, Trading Journal imports directly from Sierra Chart, journals your NinjaTrader trades through a companion connector, reads tick-level data from your SCID files, records optional per-trade screen clips, and runs on your machine with a local SQLite database. Trades, notes, screenshots, and videos stay local; internet is used for license activation, subscription refresh, and updates.
Dashboard
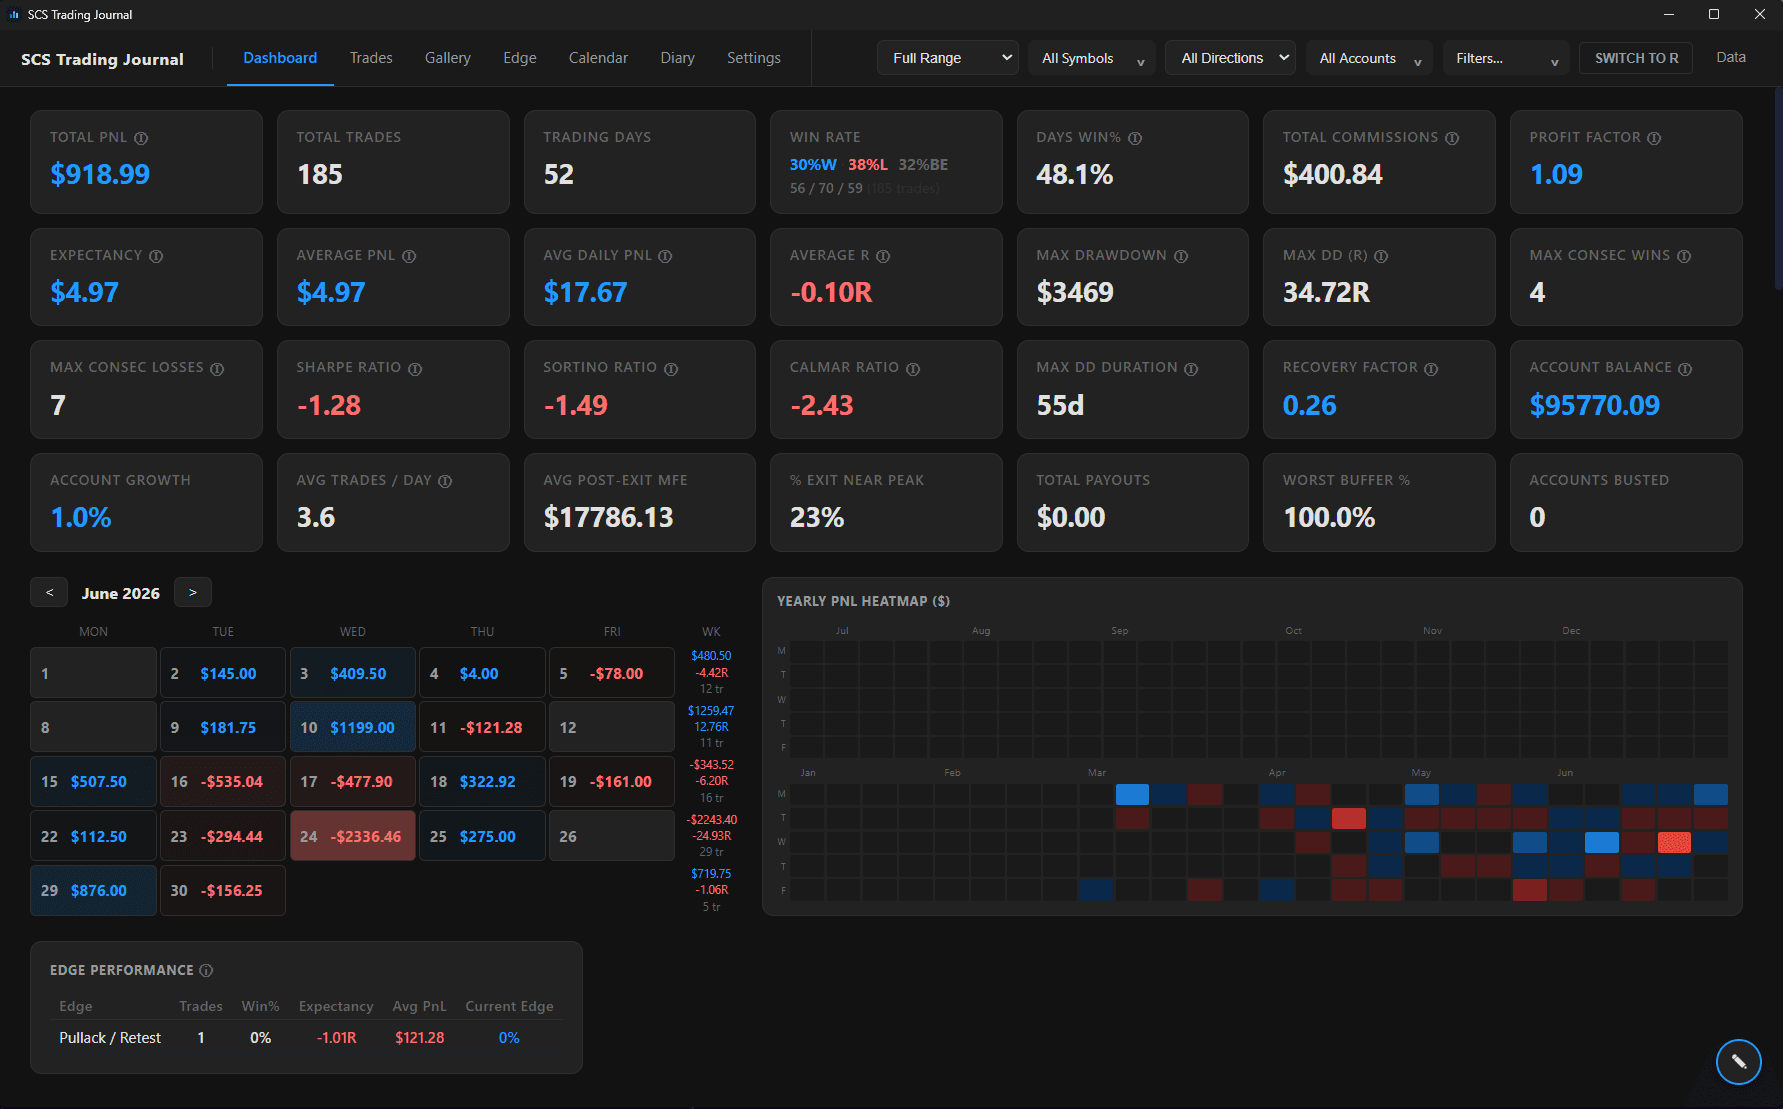
The main dashboard provides a complete statistical overview of your trading performance across any filtered date range, symbol, direction, account, strategy, checklist, or session-checklist combination. The layout is fully customizable: click the floating pencil button to unlock drag & drop reordering of dashboard panes AND KPI cards, and use the centralized Show / Hide settings section to toggle individual KPIs, dashboard panes, toolbar filters, tabs, and trade detail sections. The layout is locked by default to prevent accidental changes. A sticky notes section lets you pin reminders and observations directly on the dashboard. The dashboard also includes Edge Performance and PropFirm account panes when those systems are configured.
Date filters persist across app restarts, so you always return to the view you left.
20 Key Performance Metrics
| Metric |
Description |
| Total R / Total PnL |
Cumulative risk-adjusted return or dollar P&L |
| Total Trades |
Number of closed trades in the selected period |
| Trading Days |
Number of days with at least one trade |
| Trades Win% |
Percentage of trades closed with positive net PnL |
| Days Win% |
Percentage of trading days with positive net PnL |
| Total Commissions |
Sum of all commission costs |
| Profit Factor |
Gross profit divided by gross loss |
| Expectancy |
Average PnL per trade: expected gain per trade |
| Average PnL / Average R |
Mean net PnL or R-value per trade |
| Avg Daily PnL |
Mean net PnL per trading day |
| Max Drawdown |
Largest peak-to-trough decline in equity |
| Max DD (R) |
Maximum drawdown measured in R multiples |
| Max Consec Wins |
Longest streak of consecutive winning trades |
| Max Consec Losses |
Longest streak of consecutive losing trades |
| Sharpe Ratio |
Risk-adjusted return relative to volatility |
| Sortino Ratio |
Like Sharpe, but only penalizes downside volatility |
| Calmar Ratio |
Annualized return divided by maximum drawdown |
| Max DD Duration |
Longest period (days) spent below a prior equity peak |
| Recovery Factor |
Net profit divided by maximum drawdown |
| Account Balance |
Per-account initial balance + net PnL + deposits - withdrawals, with a tooltip breakdown |
Each KPI card can be hidden, and the whole KPI row can be reordered via drag & drop.
14 Interactive Charts
Every chart is interactive: hover for precise values (with time displayed on Cumulative R/PnL, Drawdown, and Running PnL tooltips), click to zoom, drag to pan. All info tooltips (i) show on hover with a dark background. Charts can be expanded to fullscreen.
All line charts use bicolor rendering: blue segments and points when the value is positive, red when negative. This applies to equity curves, running PnL, trade detail PnL, drawdown, and all rolling metrics. Bar charts follow the same convention: blue for positive, red for negative.
- Cumulative R / PnL: equity curve over time, bicolor blue/red segments, time in tooltips
- Daily P&L: bar chart of net R per trading day (blue positive, red negative)
- Daily % of Account: daily PnL as percentage of initial account balance
- R by Time of Day: scatter plot showing trade outcomes by entry hour
- R by Day of Week: total R per weekday (Mon–Fri only)
- Avg PnL by Symbol: average R or PnL per instrument traded
- Drawdown Curve: drawdown depth and duration from equity peak, bicolor rendering
- R Distribution: histogram of trade outcomes
- Win Rate % (10-day rolling): moving average of win rate over a rolling window
- MFE vs R: Exit Efficiency: plots final R against MFE to identify money left on the table
- MAE vs R: Heat Taken: plots final R against MAE to evaluate stop placement
- Running PnL: cumulative net PnL curve, bicolor blue/red, time in tooltips
- Rolling Avg R (10/20/50 trades): moving averages over three window sizes
- Monte Carlo Simulation: 1,000 reshuffled equity paths with P5–P95 confidence bands
Yearly Heatmap
A GitHub-style contribution grid covering the full calendar year. Each cell represents one trading day, color-coded from deep red (worst days) through neutral gray to blue (best days). Hover over any cell to see the date, net R, and number of trades. Weekends can optionally be hidden. Instantly spot weekly patterns, cold streaks, and your most productive periods.
Monthly Calendar
A traditional calendar view where each day displays its net R, number of trades, and a color indicator. The month header shows Net PnL, total R, win rate, and trade count, and the WK column summarizes each week's P&L, R, and trade count alongside the weekly-notes icon. Every day (including those without trades) shows a pencil icon for session notes, so you can record pre-market plans and post-session reviews on any date. Click any day to navigate to the session detail panel.
The Calendar tab and the Dashboard mini-calendar can optionally show full first/last weeks with adjacent-month days, so the grid never crops a partial week. The Dashboard calendar pane also has its own weekly stats column for at-a-glance weekly P&L without leaving the dashboard.
Hour × Day Heatmap
A grid with hours of the day on one axis and weekdays on the other. Each cell shows the average R for trades entered during that specific hour on that specific day. Blue cells indicate positive average R, red cells indicate negative. Use this to identify your optimal trading windows and the time slots where you consistently underperform.
Checklist Correlation Analysis
A table showing each of your custom checklist items alongside the average R of trades where that item was checked versus unchecked. Reveals which pre-trade habits and conditions actually correlate with profitability, and which ones are noise.
Trades Page
Sortable Trade Table
All trades display in a filterable, sortable table with columns for date, symbol, direction, account, entry price, exit price, R-value, MFE, MAE, duration, strategy, files, and checklist completion. Click any column header to sort. Use the filter bar (date range, symbol, direction, account multi-select, strategy, trade checklist, session checklist) to narrow the view. A Columns menu lets you show/hide every column individually, with preferences persisted per user and horizontal scrolling when overflow occurs. Open trades appear immediately as OPEN rows, so you can take notes and complete checklist items while the position is still live.
Advanced Filter Builder: build filters on any field with comparison operators, combine conditions, and save them by name. Value fields offer dropdown suggestions built from your own data (strategies, symbols, accounts), so conditions always match exactly, and saved filters drive both the trades list and the dashboard.
Notes autosave: notes you are typing on an open trade are saved automatically the moment it closes, so nothing is lost if a position closes mid-sentence.
Clickable Attachment Badges
A Files column shows minimalist badges per trade: camera count for screenshots, note badge for written notes, and a video badge when a per-trade clip exists. Click the camera to open the screenshot lightbox with keyboard navigation (Esc / ← / →). Video clips open from Trade Detail and play in the shared lightbox with speed controls and Jump-to-entry.
Bulk Actions
Select multiple trades via checkboxes to bulk-assign Account, Strategy, or Notes, bulk-archive (move to "Old trades"), or bulk-delete. Deletes are permanent and protected from re-import by a tombstone mechanism: the NDJSON watcher will never resurrect a deleted trade.
Trade Detail Panel
Click any trade to open its detail panel:
- Entry and exit: exact prices, times, and order types
- Initial Risk Override: optional manual $ or account-% risk override when the recorded stop is not the intended risk reference
- R-value: final risk-adjusted outcome
- MFE and MAE: maximum favorable and adverse excursion during the trade
- Intra-trade PnL curve: tick-by-tick profit and loss chart reconstructed from Sierra Chart binary SCID files using FIFO lot tracking (see below), rendered with bicolor blue/red segments
- Notes: free-text notes attached to the trade
- Checklist: trade-specific checklist items with check/uncheck state
- Screenshots section: attach, reorder via drag & drop, paste directly from clipboard, and pick the gallery thumbnail (see Gallery below)
- Videos section: optional per-trade clips recorded by Video Capture
Every section and individual metric in the trade detail can be hidden from Settings → Show / Hide Trade Detail Sections. The trade detail also supports previous/next navigation with side arrows and the keyboard ← / → keys, scoped to the current Trades table order.
Intra-Trade PnL Curves
Trading Journal reads Sierra Chart's binary SCID tick data files to reconstruct the exact tick-by-tick P&L of each trade. The engine uses FIFO lot tracking to correctly handle scale-ins and partial closes. The result is a precise chart showing exactly how the trade evolved from entry to exit: where it pulled back, where it extended, and how the final exit compares to the best and worst points during the trade.
This is not an approximation from bar data. It uses every recorded tick to produce the highest-resolution P&L curve possible. The detail chart supports $, R, and T (ticks) modes; the chart itself is labelled as gross PnL/R while trade KPI tiles continue to show net values where appropriate.
MFE/MAE values keep source provenance. Sierra Chart study values, SCID recompute values, and optional manual overrides are stored separately, and Trade Detail shows the active source when values diverge. You can review the divergence and promote the SCID value without silently losing the original tracker value.
Optional Post-Exit MFE tracking is forward-only: if it is enabled before a trade closes, the Sierra Chart study can continue watching after exit and report the post-exit peak, trigger reason, and optional screenshot. A trade must be monitored before it closes to receive post-exit data; closed trades cannot be backfilled. The tracker's EOD time uses the Sierra Chart machine's local clock, with no timezone conversion inside the study.
Similar Trade Matching
For any selected trade, the algorithm identifies the top 5 most similar trades in your history. Similarity is computed from four dimensions: symbol match, direction match, time-of-day proximity, and checklist item overlap. Each similar trade is displayed with its R outcome, letting you see how comparable setups have performed historically.
Edge Tracking
An Edge is a named saved filter combination, separate from simple Strategy tags. Define edges in Settings → Rules & Risk Limits → Edge Items by choosing checklist items, session-checklist items, symbols, directions, accounts, and real/missed trade types. The Edge tab then shows each edge as a performance card, and each detail view breaks the same edge across all-time, last-N occurrences, and a custom date range.
Each edge can have its own description and cover image, so you can document the setup visually while keeping Strategy Items lightweight. The Dashboard's Edge Performance pane summarizes current edge performance without forcing you to rebuild filters manually.
In Settings → Rules & Risk Limits → Edge Items, filter dropdowns stay open while you tick multiple boxes, the Session Checklist Items dropdown is organised by set (pick a set, then browse its categories), and the selected-filters summary shows one line per filter. Edge filter summaries list the actual Checklist item names instead of counts, and Edge titles can be clicked directly to rename them.
Video Capture
Video Capture is an optional Windows-only recorder that auto-clips a short video for every trade. It is off by default. When enabled, the journal records your screen continuously in the background with a rolling pre-buffer (default 30 s), then assembles a per-trade MP4 clip when the trade closes. The pre-buffer captures the price action before your entry, and recording continues for a configurable window after the close. Clips attach to the trade automatically, just like screenshots: a 🎬 badge appears in the Trades table and a Videos section in the Trade Detail plays the clip in the lightbox.
Supported modes:
- Off: no recorder running (default)
- Manual: toggle a clip on and off via the Video Clip button on the Sierra Chart study; when you stop, pick the trade to attach the clip to
- Auto on trade: closed trades receive clips automatically after the post-trade buffer is assembled
Bundled ffmpeg, zero setup. The hardware encoder is auto-detected (NVIDIA NVENC, Intel QuickSync, AMD AMF), with a CPU fallback. The recorder can capture the display containing Sierra Chart (default), a fixed display, or all displays. Microphone capture is optional for live voice notes; a silent track is used automatically if the mic is unavailable.
The Enable Video Capture Events ACSIL input lets you disable Video Capture per Sierra Chart study/chart instance, useful when you want only one specific chart to drive trade clips.
The TRADING_JOURNAL study emits UTC epoch timestamps and the chart timezone offset on every NDJSON line, so auto-clips reconcile correctly even when your Sierra Chart charts and Windows are in different timezones (e.g. CME futures shown in Chicago time while Windows runs in Berlin time).
Trade Detail playback uses the shared lightbox with 0.5×–2× speed controls and a Jump-to-entry button. Each clip can be deleted from the Trade Detail with a hover trash icon. A prompt asks whether to detach from the trade only, or also delete the video file from disk. The buffer is retained per active trade, so arbitrarily long trades are fully captured. Configurable clip retention (default 90 days) and a buffer disk cap keep disk use bounded.
Video Capture is driven entirely by the existing NDJSON trade export, so no extra Sierra Chart setup is required beyond having the journal study attached. A diagnostics action in Settings → Video Capture checks ffmpeg, devices, capture scope, encoder fallback, buffer state, and recent capture errors.
Gallery Tab
A brand-new visual view of every trade that has at least one screenshot. Each trade is shown as a card in a responsive grid with the main screenshot on top and key metrics (symbol, direction, net PnL / R, date, contract count, notes preview) below.
Fully Customizable Layout
- Cards per row: choose 1 to 6 columns from Settings → Display, the grid adapts instantly
- Card image height: set the exact pixel height of the image area (120 to 500 px)
- Every topbar filter applies: date range, symbol, direction, account, strategy filters narrow the Gallery the same way they do the Trades tab and Dashboard
Per-Trade Thumbnail with Custom Crop
Trades with multiple screenshots can have one chosen as the gallery thumbnail, and you can frame it precisely. Click the magnifier on any card to open the full lightbox. Click Use as gallery thumbnail to enter crop mode: a resizable / draggable rectangle appears over the image at the exact aspect ratio of your gallery card. Move it, resize it from any corner (aspect locked), and the Gallery card updates live as you drag. Everything auto-saves, with no Save button to click. Click Set as gallery thumbnail to swap which image represents the trade without opening the crop editor.
Card Click Behavior
Click anywhere on a card (outside the magnifier icon) to open the full trade detail overlay, exactly as clicking a row in the Trades tab.
Calendar Page
Session Detail Panel
Click any day on the calendar to open the session detail panel:
- Daily statistics: net R, number of trades, win rate, profit factor, and average R for the session
- Running PnL chart: cumulative R throughout the trading day, trade by trade, displayed in a larger chart area with smaller trade markers for better readability
- Rule violations: any risk management rules broken during the session (see Rules section)
- Screenshots: attach, drag & drop, and paste images directly from the clipboard for the active session checklist set
- Session notes: free-text notes for end-of-day review, isolated per session checklist set
Click any trade in the session panel to dive into its detail.
Weekly and monthly note buttons let you record broader review comments from the WK column or the month header, independent of daily session notes.
Session Checklist
A separate checklist from the trade-level checklist, designed for session-level habits: pre-market preparation, post-session review, emotional state, etc. Session Checklist items can be organized into named sets, reordered as sets, and filtered through Set → Category → Item navigation. The Diary page shows one global active set at a time, and each session stores notes/screenshots independently per set.
Trade and Session Checklist items can also be numeric gauges instead of simple checkboxes. Gauge items store a 1-to-N value, support lower-is-better scoring, and appear in Trade Detail, Session Detail, and Diary as scored process tags.
The Pre-Trade Checklist can be armed per symbol, and the whole panel can be hidden from Settings (Show/Hide) if you prefer a minimal layout.
Diary Page
The Diary page is the daily-process view for Session Checklist work. Session Checklist visibility on Diary is multi-select (show all sets, no sets, or any subset), so you can focus on a single routine (pre-market, EOD review, instrument-specific checklist) or review several side by side. Calendar session notes and screenshots remain isolated per set.
Each day tile shows the day's mistake cost and total R at a glance. The Session Detail keeps the session header pinned while you scroll, adds previous/next day arrows for fast review, and a Cost of Mistakes card totals what your rule breaks and tagged mistakes cost you for that session, in dollars and in R.
Screenshots & Clipboard Paste
Screenshots attached to trades or sessions support three input methods:
- Drag & drop an image file from Windows Explorer into the drop zone
- Click to browse and pick one or multiple image files
- Paste from clipboard: a dedicated Click here to paste from clipboard (or press Ctrl+V) zone captures whatever image is in your clipboard and saves it instantly, under the same filename convention as file-picked screenshots. No intermediate "save-to-disk-then-select" step: copy a chart snippet from Sierra Chart, a browser, or any image source, and paste directly
Inside the trade detail, screenshots can be reordered via drag & drop. The new order is persisted, and the Gallery fallback thumbnail follows the first image when no explicit thumbnail is picked.
Missed Trades
Log trades you identified but did not take from the same + button used for manual real trades, choosing Missed in the menu. Missed trades live in the unified Trades workflow and can be shown or hidden with the toolbar Trade Type filter. Each missed trade records the symbol, direction, entry time, theoretical stop and target levels, and a reason for not taking it. The journal calculates what the R outcome would have been, giving you a running total of opportunity cost. Over time, this reveals whether your edge comes from the trades you take or the ones you skip.
Settings split page
The Settings tab is a single split page: Rules & Risk Limits on the left, Settings on the right (50/50 on wide screens, stacked on narrow). Every sub-section is a collapsible dropdown with a count badge and an ⓘ tooltip explaining what it controls. One-click Expand all / Collapse all icons open or close every dropdown in a column.
Rules & Risk Management
| Rule Type |
Description |
| Max trades per day |
Hard limit on number of trades per session |
| Max R loss per day |
Stop trading after cumulative daily loss exceeds threshold |
| Max $ loss per day |
Dollar-based daily loss limit |
| Time window |
Only allow trades within defined hours (e.g., 9:30–11:30 and 13:00–15:00) |
Violations are tracked automatically and displayed on the session detail panel. The dashboard shows violation frequency over time, so you can measure whether your discipline is improving.
Each rule can also be assigned a value or a time inline, renamed in place, and flagged as a hard stop (see Live Rule Enforcement below).
Live Rules & Risk Limits Panel on Your Chart
Your rules do not just live inside the journal. The TRADING_JOURNAL Sierra Chart study draws a live Rules & Risk Limits panel directly on your chart, so you always see where you stand without switching windows. Each rule gets its own line with its current value against the limit: trades taken (for example 3/5), time remaining or time exceeded on a trading window, cooldown countdown, and daily loss in $ or R versus your cap. The panel title stays blue while every rule is respected and turns red the instant one is broken, with a configurable colored background and an optional audio alert. Position, font, line spacing, colors, the all-rules versus breached-only display mode, and the alert sound are all configurable from the study inputs.
When a rule fires, the alert names it: the in-app sound and the Sierra Chart Alerts Log both tell you exactly which limit you hit, so you know why trading was blocked without leaving your chart.
Hard-Stop Enforcement: Cut Live Trading When You Break a Rule
Any rule can be marked as a hard stop. Paired with the Trade Manager study, a broken hard-stop rule does more than log a violation: Trade Manager automatically blocks new entries on your live accounts, enforcing the discipline you set for yourself. Your Sim accounts stay free, so you can keep practicing while your real money is protected, and exits or trade management are never blocked. The journal evaluates your rules continuously and signals Trade Manager in real time, so re-enabling a rule or starting a fresh session lifts the block automatically.
Accounts, Strategies, Checklists
Create, rename (pencil icon), delete, and reorder (drag handle) custom Account, Strategy, Trade Checklist, and Session Checklist items. Session Checklist items live inside named sets, and those sets can also be reordered. Compact item rows keep long lists readable without endless scrolling.
Edge Items
Edge Items are managed separately from Strategy Items. An Edge owns the description, cover image, and saved filter definition used for the Edge tab and Dashboard Edge Performance pane. Strategies remain simple tags.
PropFirm Configuration
PropFirm Configuration tracks account-level evaluation rules such as drawdown type, drawdown buffer, optional trailing-to-static lock target, profit target remaining, and manual payout ledger entries. It powers the PropFirm dashboard pane and does not change trade PnL, R-value, or win-rate calculations.
Account cash movements are tracked separately as deposits, withdrawals, and payouts. This lets account-level reporting reflect capital changes without rewriting historical trade records.
Each account can have its own initial balance and a date-only cash ledger. Deposits and withdrawals affect Account Balance but are independent of the toolbar trade date filter; payouts also feed the PropFirm dashboard statistics. The Account Balance KPI tooltip breaks the value down into Initial, Net PnL, Deposits, Withdrawals, and Current.
Per-Account, Per-Symbol Commissions
Every account row has a dedicated blue Commissions button that opens a searchable table where you set commission ($ per round turn) per symbol, for that account specifically. Toggle Use Sierra Chart commissions off in Settings → Commissions to apply your own commission rates instead of the ones SC exports. A Recompute commissions on all existing trades button re-applies the active rules to every imported trade and refreshes the session aggregates.
Trading settings include Break-Even Threshold in $, %, or ticks, optional net-R calculation including commissions, and a Recompute R-values action for applying the current risk settings to existing trades.
Show / Hide (centralized)
One section at the top of Settings groups all visibility toggles:
- Toolbar Filters: date range, symbol, direction, account, strategy, trade checklist, session checklist
- Tabs: Dashboard, Trades, Gallery, Edge, Calendar, Diary, Settings
- KPI Cards: every metric on the dashboard individually
- Dashboard Panes: every chart and section
- Trade Detail Sections: sections (metrics grid, actions, PnL chart, strategy, checklist, notes, screenshots, videos, similar trades) and individual metrics (Net PnL, Initial Risk, Commission, R-Value, Points, Duration, MFE, MAE, Efficiency, Entry/Exit/Stop, Qty)
Auto-Save
There is no Save Settings button. Every change (font size, commissions, risk mode, toggles, initial balance, always-on-top, gallery cards per row / card height, etc.) is persisted the moment you interact with it. Text inputs save 400 ms after you stop typing; checkboxes and dropdowns save instantly. A small green ✓ Saved indicator confirms each write.
When Default Risk mode is set to fixed ticks, an optional stop auto-fill derives a visible stop price from entry ± risk ticks for newly imported trades that have no stop. This preserves the same initial-risk math as the tick fallback and is mainly a visibility/replay aid.
Settings → Data can also watch Additional Journal Directories for multiple Sierra Chart instances, and Settings → Display includes View on Chart replay style, micro-on-full chart replay, MFE/MAE display format, table density, global font size, and Gallery card layout.
Screenshot Settings
The Sierra Chart study can capture screenshots automatically or from an ACS button. Settings → Screenshot controls:
- Auto-screenshot trigger: Off, All Fills, or First and Last Fill
- Capture mode: Chart Window, Chartbook, Chartbook Symbol Matching, Main Sierra Chart Window, or Desktop
- Manual attachment: attach to the latest trade on the chart symbol or ask each time
- Trade triangle size: small, medium, or large chart markers
- EOD final screenshot: optional independent screenshot per trade at the configured EOD time
The missing-screenshot diagnostic checks the journal directory, auto folder, matching files, DB references, and per-trade screenshot files so support can identify attachment problems quickly.
Global Font Size
A Global Font Size stepper in Settings → Display scales the entire renderer (topnav, settings, modals, charts, overlays) via Electron's webFrame.setZoomFactor. Default offset is +2 for a slightly larger comfortable baseline.
Monte Carlo Simulation
The Monte Carlo engine takes your actual trade results and reshuffles them 1,000 times to generate simulated equity curves. This answers the question: "Given the trades I've taken, how much of my outcome is skill versus luck?"
The simulation produces:
- Median equity curve: the 50th percentile path
- P5–P95 confidence band: the range where 90% of simulated outcomes fall
- P1 worst case: the 1st percentile outcome
- Ruin probability: percentage of simulations that hit a user-defined drawdown threshold
- Terminal R distribution: histogram of final cumulative R across all 1,000 simulations
Sierra Chart Integration
Works Hand-in-Hand with Trade Manager
Trading Journal is designed to work seamlessly with the Trade Manager study. When you enter a position via Trade Manager, the stop loss level you drew on the chart is automatically captured and passed to the journal, so each imported trade arrives with its exact risk reference already filled in. The result: R-values, MFE, and MAE are computed automatically, with zero manual data entry. Just trade with Trade Manager, and your journal fills itself.
Automatic Import
Trading Journal watches your configured journal folder and automatically imports new trades every 5 seconds. Open trades can appear as OPEN rows before the exit is received, then reconcile into the closed trade when the final fill arrives. Deleted trades are protected by a tombstone table. Once you delete a trade (single or bulk), the import engine will never silently re-add it, even if the source NDJSON file still contains the row.
Multi-Account Support
All import paths track the originating account. The toolbar has a multi-select account checklist to filter the Dashboard, Trades, Gallery, and Calendar by any combination of accounts simultaneously. New accounts discovered during an import are automatically added to the active filter selection so nothing disappears silently.
Import Methods
| Method |
Description |
| Automatic (NDJSON) |
The Sierra Chart study writes NDJSON files that the journal imports automatically every 5 seconds |
| Manual (SC TradesList) |
Data → Import SC TradesList… imports a .txt file exported from Sierra Chart's Trade Activity Log |
| Re-import Last TradesList |
The ⟳ button in the Data menu repeats the last manual import without reopening the file picker |
| Auto-import TradesList on change |
Watch the last imported TradesList file and re-import it when Sierra Chart overwrites it |
Users running multiple Sierra Chart instances can configure Additional Journal Directories. Each folder is watched in parallel with the primary Journal Directory.
Manual Import
Manual TradesList import supports both Sierra Chart export modes:
- Trades: flat-to-flat trade groups (one row per round-trip trade)
- Fills: individual fill records (the journal reconstructs trades from raw fills)
Three Sierra Chart symbol naming conventions are recognized automatically:
| Convention |
Example |
Description |
| Teton |
ESH26_FUT_CME |
Full contract with exchange suffix |
| Rithmic dot |
ESM6.CME |
Short contract with dot-separated exchange |
| Rithmic dash |
ES-202506 |
Symbol with year-month suffix |
Micro contracts (MES, MNQ, etc.) are auto-detected based on tick value, so the correct instrument definition is applied regardless of naming convention. Multi-account exports are parsed robustly: if a flat-to-flat group boundary marker is missing at an account transition, the parser flushes the previous account's trades under its own account before starting the next.
Auto-importing the last TradesList file is duplicate-safe and is the recommended workaround for order-allocation sibling accounts that are not streamed by their own chart-hosted TRADING_JOURNAL study.
SCID Tick Data
Trading Journal reads Sierra Chart's binary SCID files directly to reconstruct intra-trade PnL curves at tick resolution. Point the journal to your Sierra Chart data folder and it automatically locates the correct SCID file for each trade's symbol. MFE/MAE values can come from the SC study's tick-by-tick tracker or from an explicit SCID recompute; the active source is tracked instead of being silently overwritten.
One-Click Chart Replay
From any trade detail panel, click the replay button to open Sierra Chart at the exact date and time of the trade entry, with fill markers showing your entry and exit points. Review the price action around your trade without manually scrolling through charts.
When the chart is frozen by View on Chart, a persistent Back to Live pill appears in the journal's top bar so you can return Sierra Chart to live data even after switching tabs or restarting the app.
NinjaTrader Integration
Trading Journal also journals your NinjaTrader 8 trades. A companion NinjaTrader connector (an AddOn that runs inside NinjaTrader) streams your executions to the app, where they are reconstructed into trades and enriched with the same KPIs, charts, and analytics as your Sierra Chart trades. Both platforms feed the same local journal, so all your performance lives in one place.
The connector requires the Trading Journal app installed and activated. It is the same Electron application: there is no separate NinjaTrader build of the journal. Owners download the connector from their account, drop it into NinjaTrader, and restart. Full step-by-step instructions are in the documentation.
License & Offline Use
The current license system uses server-issued signed tokens stored locally in encrypted, hardware-bound storage. Activation is online. After activation, lifetime licenses validate locally and are designed for offline use; subscription licenses refresh periodically and include a grace period if refresh temporarily fails.
Lifetime users can use Release this device in Settings → License to free one activation slot before moving to another computer.
Activations include silent server-side recovery for users whose local license data becomes unreadable (antivirus quarantine, disk error). Background re-verification runs once per day, so revoked or expired licenses take effect within 24 hours even on long-running sessions. Two safety nets keep you trading: subscription refreshes carry a 7-day offline grace period, and if your local license data ever becomes unreadable while the server is unreachable, a separate 48-hour recovery grace with a clear banner keeps the app fully usable while you reconnect. Settings → License shows a contextual action button for every state (Activate, Re-enter key, Manage subscription, Release device, Retry recovery) plus a Diagnostic info section useful when contacting support.
The Windows installer is SHA256 Authenticode-signed by SSL.com (publisher: SCStudies), so auto-updates apply cleanly without Windows SmartScreen friction.
Display Mode Toggle
A "SWITCH TO R" / "SWITCH TO $" toggle button switches the entire journal between two display modes:
- R-value mode: all metrics, charts, and tables display risk multiples (e.g., +2.3R, -0.8R)
- Dollar mode: all metrics, charts, and tables display dollar amounts (e.g., +$460, -$160)
The toggle applies everywhere simultaneously: dashboard KPIs, equity curve axis, trade table columns, session stats, Monte Carlo projections, and Gallery cards.
Updates & "What's New" Popup
The journal ships with electron-updater, so new versions are downloaded and installed automatically in the background. After any update (or when you catch up across multiple versions at once), a What's New popup lists every Added / Changed / Fixed entry for every release between the last one you saw and the new one, stacked newest-first in a single view, never only the latest release's notes.
Version status, Check for updates, restart-to-install, and the full changelog live in Settings → Update. The changelog can be expanded into a centered modal for easier reading. The top menu groups file-oriented actions under Data: Import SC TradesList…, the ⟳ quick re-import button, Sync Sierra Chart trades, and Export Trades to CSV….
Supported Instruments
Index Futures
| Standard |
Micro |
Tick Size |
Tick Value |
| ES |
MES |
0.25 |
$12.50 / $1.25 |
| NQ |
MNQ |
0.25 |
$5.00 / $0.50 |
| YM |
MYM |
1.00 |
$5.00 / $0.50 |
| RTY |
M2K |
0.10 |
$5.00 / $0.50 |
Energy
| Standard |
Micro |
Tick Size |
Tick Value |
| CL |
MCL |
0.01 |
$10.00 / $1.00 |
Metals
| Standard |
Micro |
Tick Size |
Tick Value |
| GC |
MGC |
0.10 |
$10.00 / $1.00 |
Bonds
ZB, UB, TN, ZN, ZF, ZT
Currencies
6E, M6E, 6J, 6B, M6B, 6A, M6A, 6C, 6S, 6N, 6M
Grains
ZS, ZW, ZC, ZM, ZL
Meat
LE, HE, GF
Softs
SB, KC, CC, CT, OJ
Crypto
BTC, MBT, ETH, MET
Custom symbols can be added manually with user-defined tick size and tick value.
Export
CSV Export
Export your filtered trade list as a CSV file. All columns from the trade table are included: date, symbol, direction, entry, exit, R-value, MFE, MAE, duration, account, strategy, and checklist items.
PDF Export
Generate a PDF report of the full dashboard including all 14 charts, the yearly heatmap, KPI summary, and checklist correlation table. Suitable for sharing with mentors, prop firms, or for your own records.
Requirements
- Windows 10 or later
- Sierra Chart or NinjaTrader 8 for automatic trade import (intra-trade SCID tick curves are Sierra Chart only)
- Internet required for license activation and auto-updates; all trade data is stored locally, never sent to any server